Jun-Hyun Bae, Minho Lee, Heechul Jung
Kyungpook National University
Abstract
Training deep neural networks with empirical risk minimization (ERM) often captures dataset biases, hindering generalization to new or unseen data. Previous solutions either require prior knowledge of biases or utilize training intentionally biased models as auxiliaries; however, they still suffer from multiple biases. To address this, we introduce Adaptive Bias Discovery (ABD), a novel learning framework designed to mitigate the impact of multiple unknown biases. ABD trains an auxiliary model to be adapted to biases based on the debiased parameters from the debiasing phase, allowing it to navigate through multiple biases. Then, samples are reweighted based on the discovered biases to update debiased parameters. Extensive evaluations of synthetic experiments and real-world datasets demonstrate that ABD consistently outperforms existing methods, particularly in real-world applications where multiple unknown biases are prevalent.
Overview
We propose a learning framework that sequentially discovers and removes multiple biases in data without any prior bias information.
- Bias-adapted model — Generate a bias-sensitive auxiliary model \(f_\phi\) via one-step gradient descent from the debiased parameters \(\theta\) .
- Adaptive group formation — Partition data into a bias-aligned group (\(G^\odot\) ) and a bias-conflicting group (\(G^\otimes\) ) based on \(f_\phi\) ’s predictions.
- Iterative debiasing — Minimize worst-case group loss via group DRO; as \(\theta\) becomes robust to one bias, \(\phi\) naturally discovers the next.
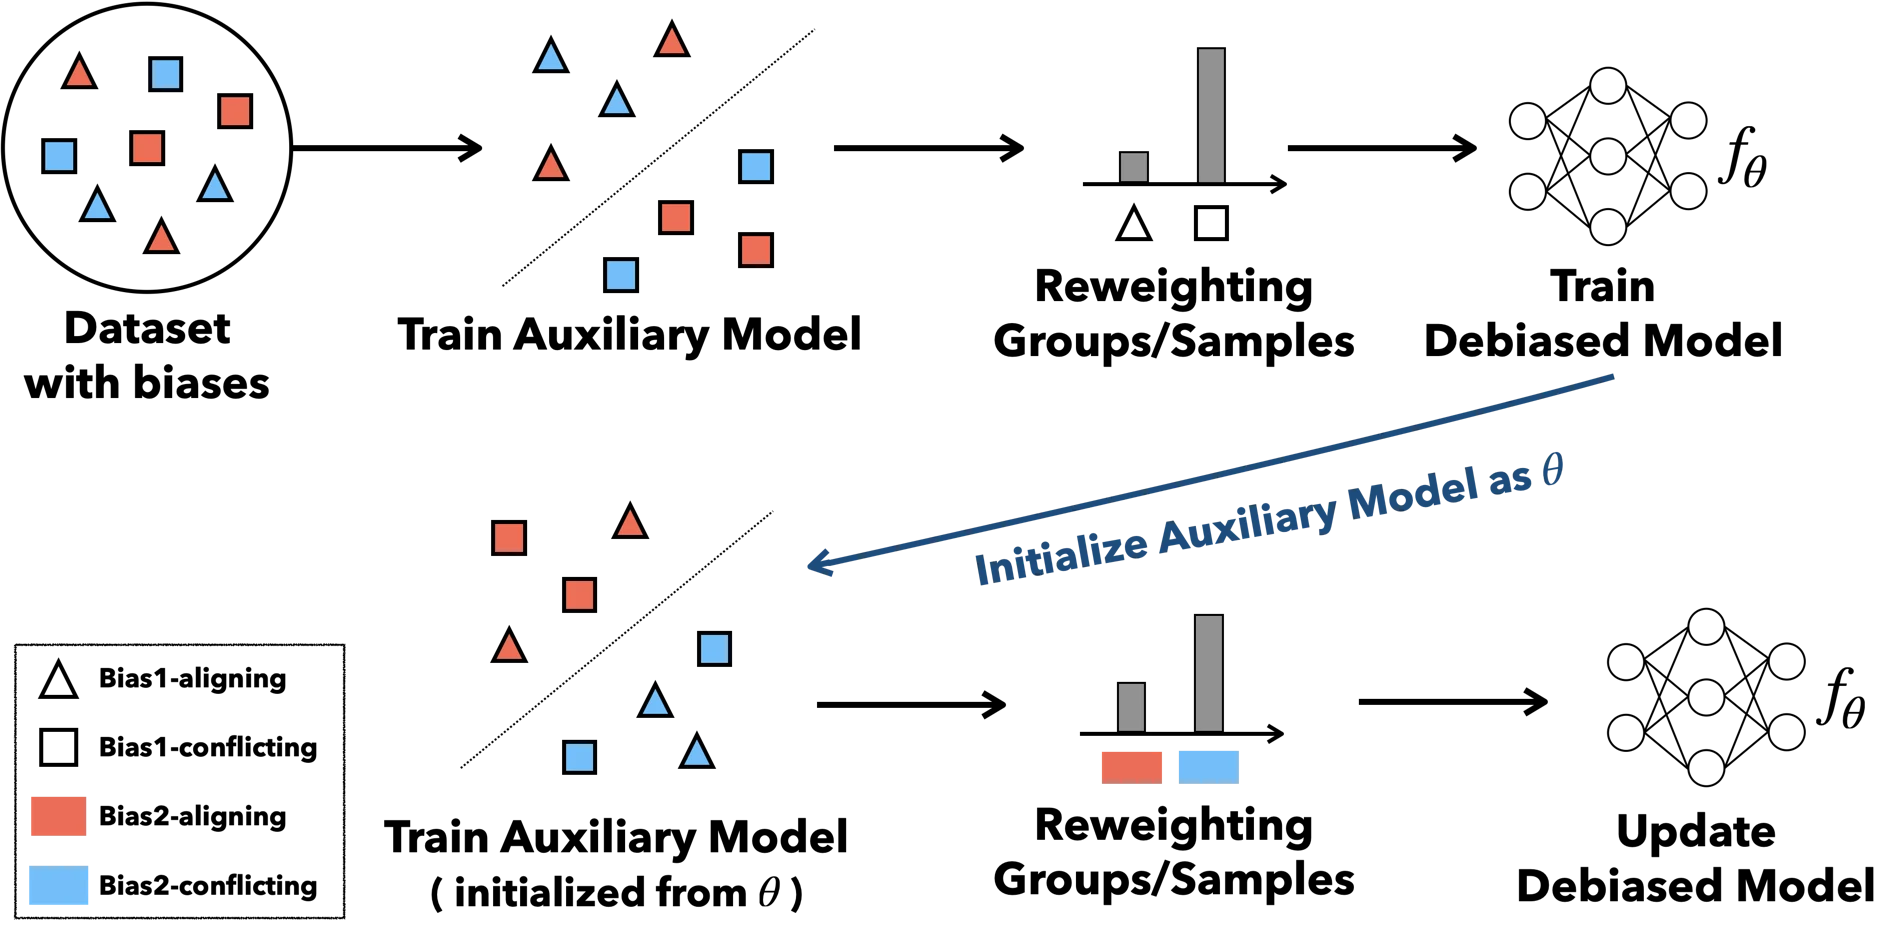
Overview of the ABD framework. Illustrated with two biases (Bias1, Bias2) and two learning steps.
Method
Models trained with ERM readily capture spurious correlations in the data, degrading generalization. Existing debiasing methods either require prior knowledge of biases (Group DRO) or can only handle a single bias type (PI, JTT).
ABD operates in two stages. First, bias-adapted parameters \(\phi = \theta - \alpha \nabla_\theta \mathcal{L}(f_\theta)\) are obtained via one-step gradient descent from the debiased parameters \(\theta\) . Since \(f_\phi\) is sensitive to superficial patterns, its predictions partition the data into a bias-aligned group (\(G^\odot\) ) and a bias-conflicting group (\(G^\otimes\) ). The debiased parameters \(\theta\) are then updated by minimizing the worst-case group loss via group DRO.
The key insight is that \(\phi\) is regenerated from \(\theta\) at every step. Once \(\theta\) becomes robust to the first bias, \(\phi\) naturally discovers the next most prominent bias. This MAML-like structure enables sequential discovery and removal of multiple biases without any prior bias information.
The GradCAM visualizations below show how the biased model \(f_\phi\) ’s attention shifts to different regions as training progresses, providing visual evidence that ABD adaptively discovers diverse biases during learning.
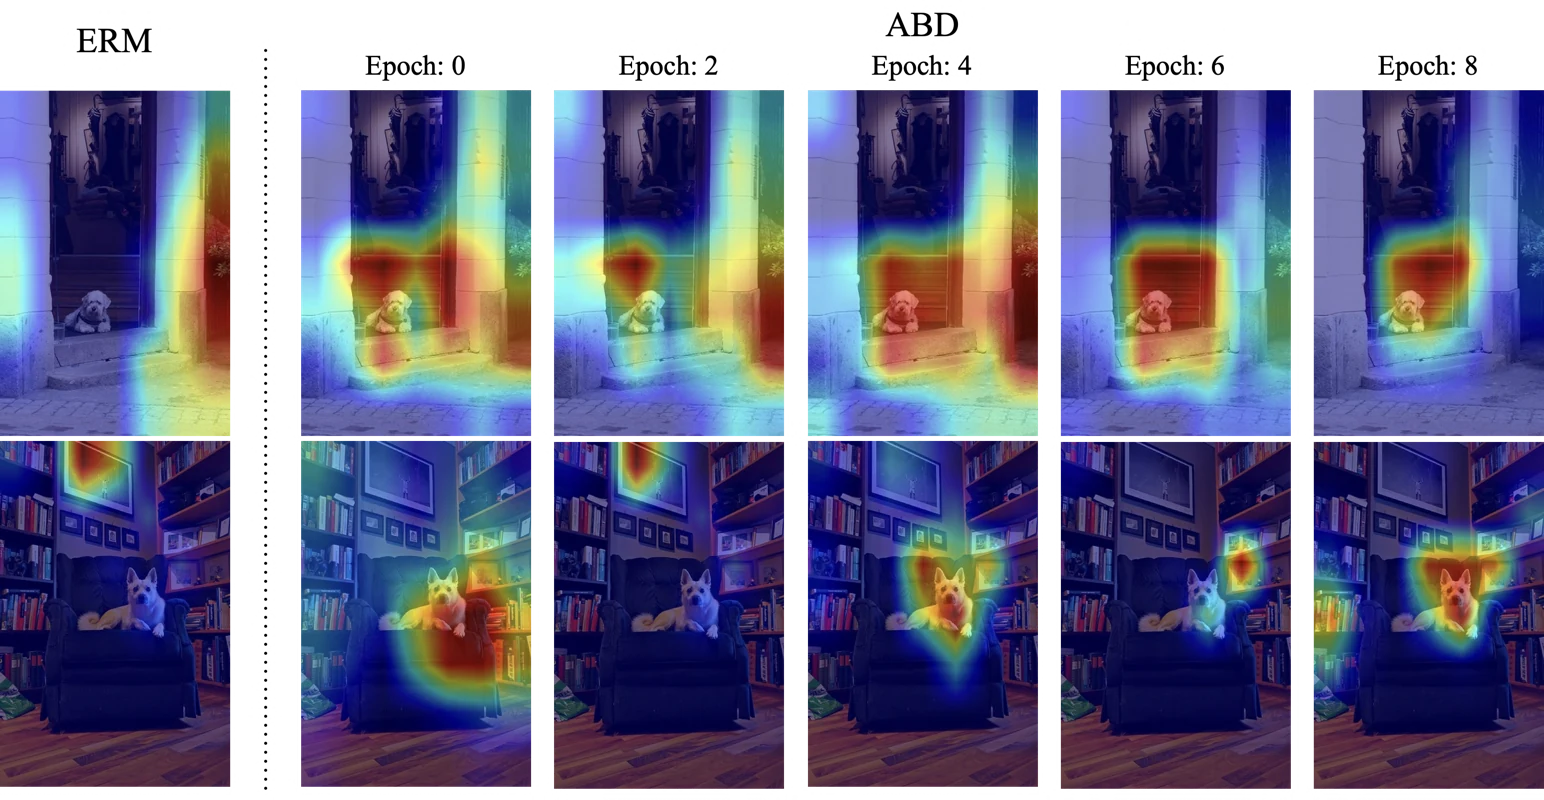
GradCAM visualizations of ERM and ABD's biased model $f_\phi$. As training progresses, $f_\phi$'s attention shifts to different bias features.
Results
Colored MNIST — Handling Multiple Biases
This experiment best demonstrates the difference from existing methods, comparing single-bias (Color) and dual-bias (Color + Patch) settings.
OoD test accuracy (%). Single bias vs. multiple biases.
| Algorithm | Color (OoD) | Color & Patch (OoD) |
|---|---|---|
| ERM | 16.4 | 14.0 |
| IRM | 66.9 | 13.4 |
| Group DRO | 13.6 | 14.1 |
| PI | 70.2 | 15.3 |
| ABD (Ours) | 70.7 | 62.3 |
| Optimal | 75.0 | 75.0 |
PI discovers only the Color bias and fails to capture Patch, effectively collapsing to 15.3% (a 54.9pp drop) when two biases are present. IRM and Group DRO also remain at the ERM level in the multi-bias setting. ABD sequentially discovers Color then Patch, making it the only method to achieve meaningful OoD performance (62.3%) under multiple biases.
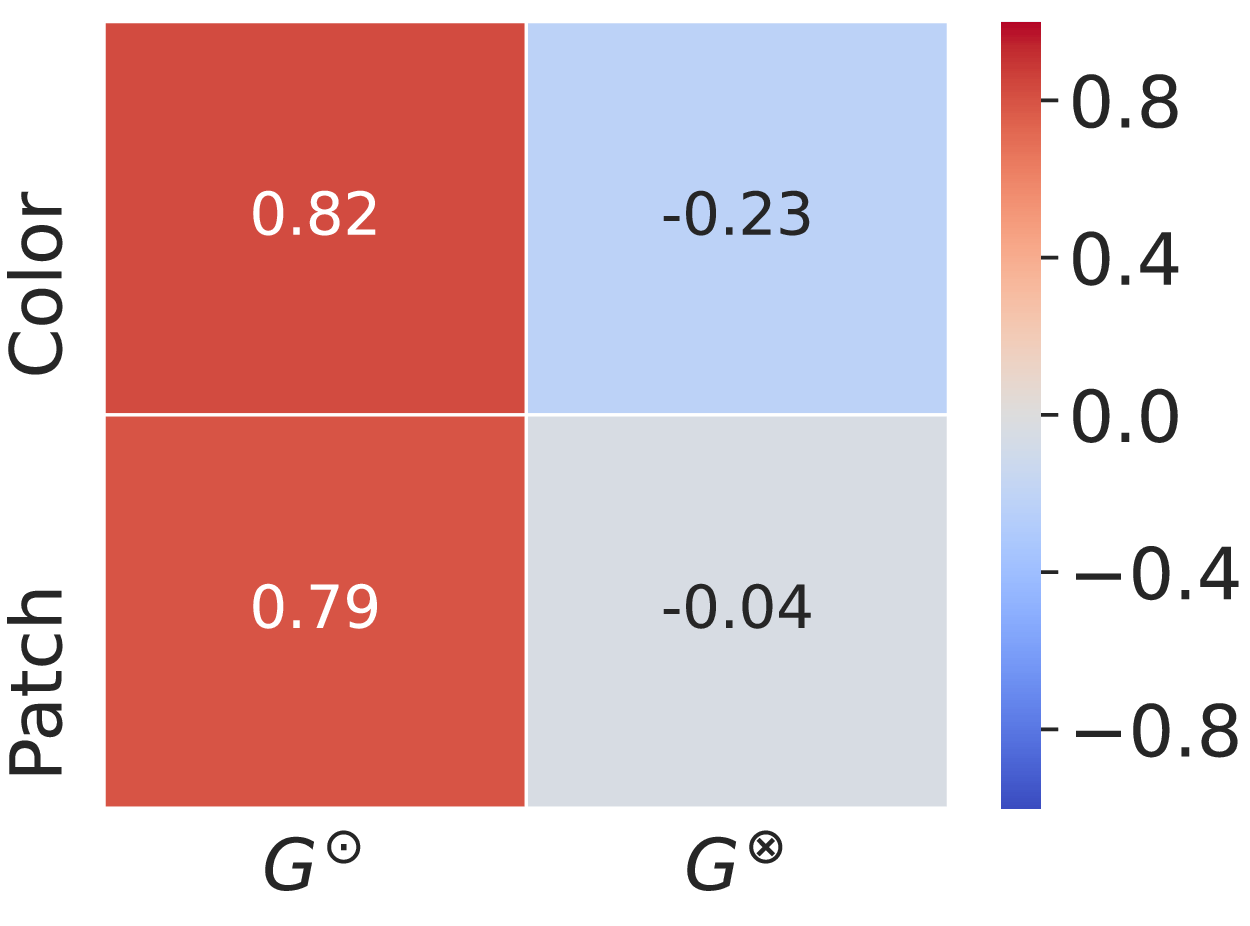
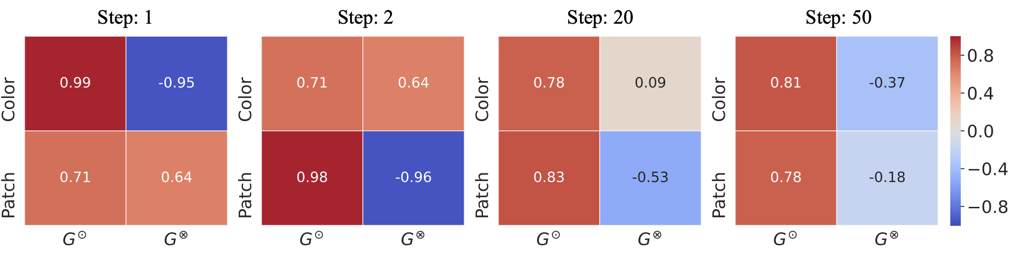
Pearson correlation coefficients within groups.
Real-World Tasks
Datasets with bias annotations — CivilComments & MultiNLI
Worst-case test accuracy (%). The Group column for CivilComments lists the demographic information each algorithm uses for grouping. On MultiNLI, Group DRO* is an oracle setting using groups hand-crafted from prior bias knowledge.
| Algorithm | CivilComments | Group (CC) | MultiNLI |
|---|---|---|---|
| ERM | 56.0 | None | 61.8 |
| IRM | 66.3 | (label × Black) | — |
| Group DRO | 69.1 | (label) | 62.7 |
| Group DRO | 70.0 | (label × Black) | — |
| JTT | 69.3 | None | 63.2 |
| PI | 61.1 | None | 61.5 |
| ABD (Ours) | 71.1 | None | 67.1 |
| Group DRO* (oracle) | — | — | 67.5 |
Datasets without bias annotations — Camelyon17 & FMoW (WILDS)
Camelyon17-wilds reports OoD average accuracy; FMoW-wilds reports worst-region accuracy (%).
| Algorithm | Camelyon17 | FMoW |
|---|---|---|
| ERM | 70.3 ± 6.4 | 32.3 ± 1.3 |
| IRM | 59.5 ± 7.7 | 31.7 ± 1.2 |
| Group DRO | 68.4 ± 7.3 | 30.8 ± 0.8 |
| CORAL | 59.5 ± 7.7 | 32.8 ± 0.7 |
| JTT | 63.8 ± 1.4 | 33.4 ± 0.9 |
| PI | 71.7 ± 7.5 | 31.2 ± 0.3 |
| CGD | 69.4 ± 7.9 | 32.0 ± 2.3 |
| LISA | 77.1 ± 6.5 | 35.5 ± 0.7 |
| ABD (Ours) | 81.1 ± 4.8 | 34.1 ± 2.5 |
On CivilComments, ABD (71.1%) surpasses Group DRO (label × Black, 70.0%) which uses bias annotations, without any annotations of its own. On MultiNLI, ABD (67.1%) lands within 0.4pp of the oracle Group DRO* (67.5%) that relies on hand-crafted groups — matching it without any bias information. On Camelyon17, ABD achieves +4.0pp over LISA (81.1% vs 77.1%), and remains competitive with LISA on FMoW. Distribution-alignment and invariance baselines (IRM, CORAL, CGD) stay at or below the ERM level on the WILDS benchmarks.
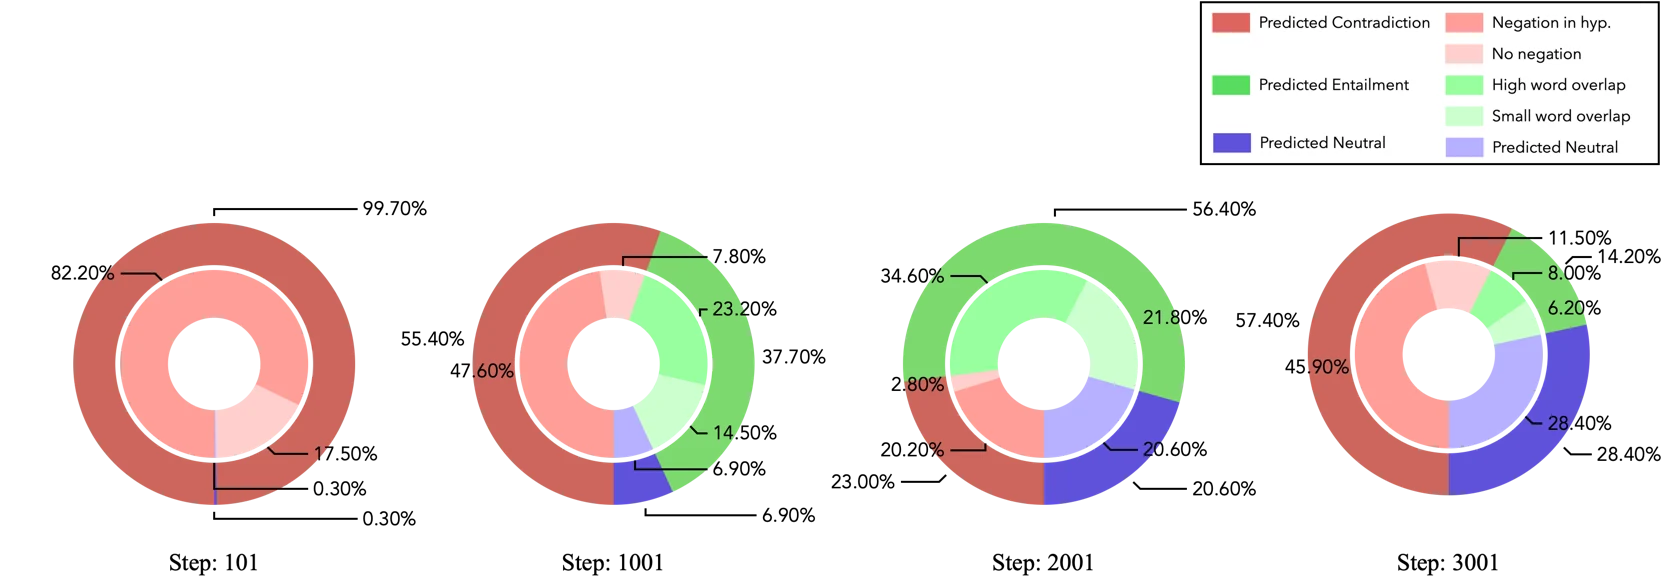
Composition of bias features in the misclassified group $G^\otimes$ on MultiNLI. After discovering Negation bias, Overlap bias gradually emerges.
MetaShift — Performance Across Distributional Distances
On MetaShift, we vary the distributional distance between training and test to evaluate the robustness of each method. ABD’s advantage becomes more pronounced as the distributional distance increases.
MetaShift test accuracy (%). Larger distance indicates greater distributional shift.
| Distance | 0.44 | 0.71 | 1.12 | 1.43 |
|---|---|---|---|---|
| ERM | 80.1 | 68.4 | 52.1 | 33.2 |
| IRM | 79.5 | 67.4 | 51.8 | 32.0 |
| Group DRO | 77.0 | 68.9 | 51.9 | 34.2 |
| LISA | 81.3 | 69.7 | 54.2 | 37.5 |
| ABD (Ours) | 80.4 | 71.8 | 55.2 | 41.8 |
At the smallest distance (0.44), LISA (81.3%) holds a slight edge, but as distance increases, ABD’s advantage becomes clear — at 1.43, ABD (41.8%) surpasses LISA (37.5%) by 4.3pp. This demonstrates that ABD is particularly well-suited for real-world OoD scenarios with large distributional shifts.
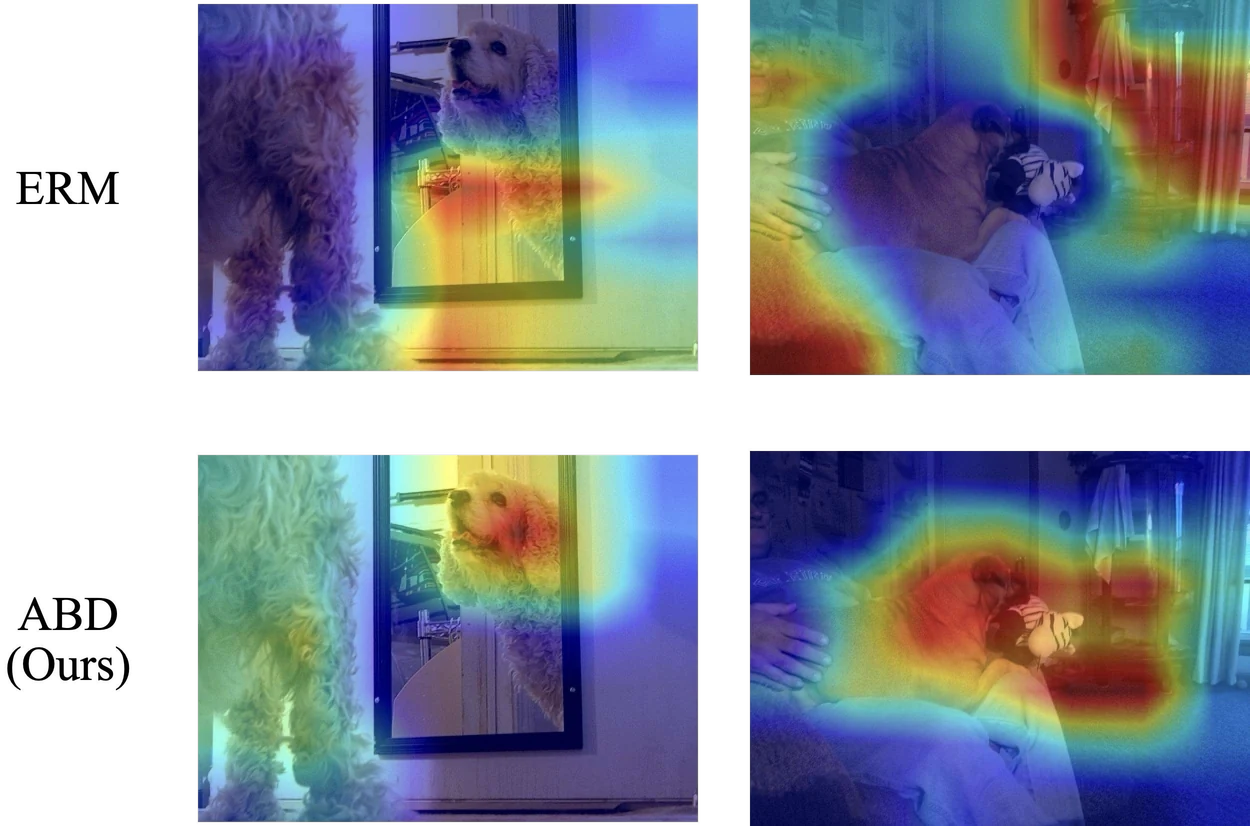
GradCAM visualizations on MetaShift test data. ERM relies on background features, while ABD focuses on the target object.