Jun-Hyun Bae, Inchul Choi, Minho Lee
Kyungpook National University
Abstract
Empirical Risk Minimization (ERM) based machine learning algorithms have suffered from weak generalization performance on data obtained from out-of-distribution (OOD). To address this problem, Invariant Risk Minimization (IRM) objective was suggested to find invariant optimal predictor which is less affected by the changes in data distribution. However, even with such progress, IRMv1, the practical formulation of IRM, still shows performance degradation when there are not enough training data, and even fails to generalize to OOD, if the number of spurious correlations is larger than the number of environments. In this paper, to address such problems, we propose a novel meta-learning based approach for IRM. In this method, we do not assume the linearity of classifier for the ease of optimization, and solve ideal bi-level IRM objective with Model-Agnostic Meta-Learning (MAML) framework. Our method is more robust to the data with spurious correlations and can provide an invariant optimal classifier even when data from each distribution are scarce. In experiments, we demonstrate that our algorithm not only has better OOD generalization performance than IRMv1 and all IRM variants, but also addresses the weakness of IRMv1 with improved stability.
Overview
We directly solve the ideal IRM bi-level optimization using the MAML framework, assigning different training environments to inner and outer loops to learn invariant features.
- Environment-specific adaptation — Adapt model parameters to each training environment \(e_i\) in the inner loop.
- Cross-environment evaluation — Evaluate the adapted parameters \(\theta_i'\) on a different environment \(e_j\) to compute the meta-loss.
- Invariant convergence — Combining gradients from different environments cancels spurious correlations, converging toward invariant features.
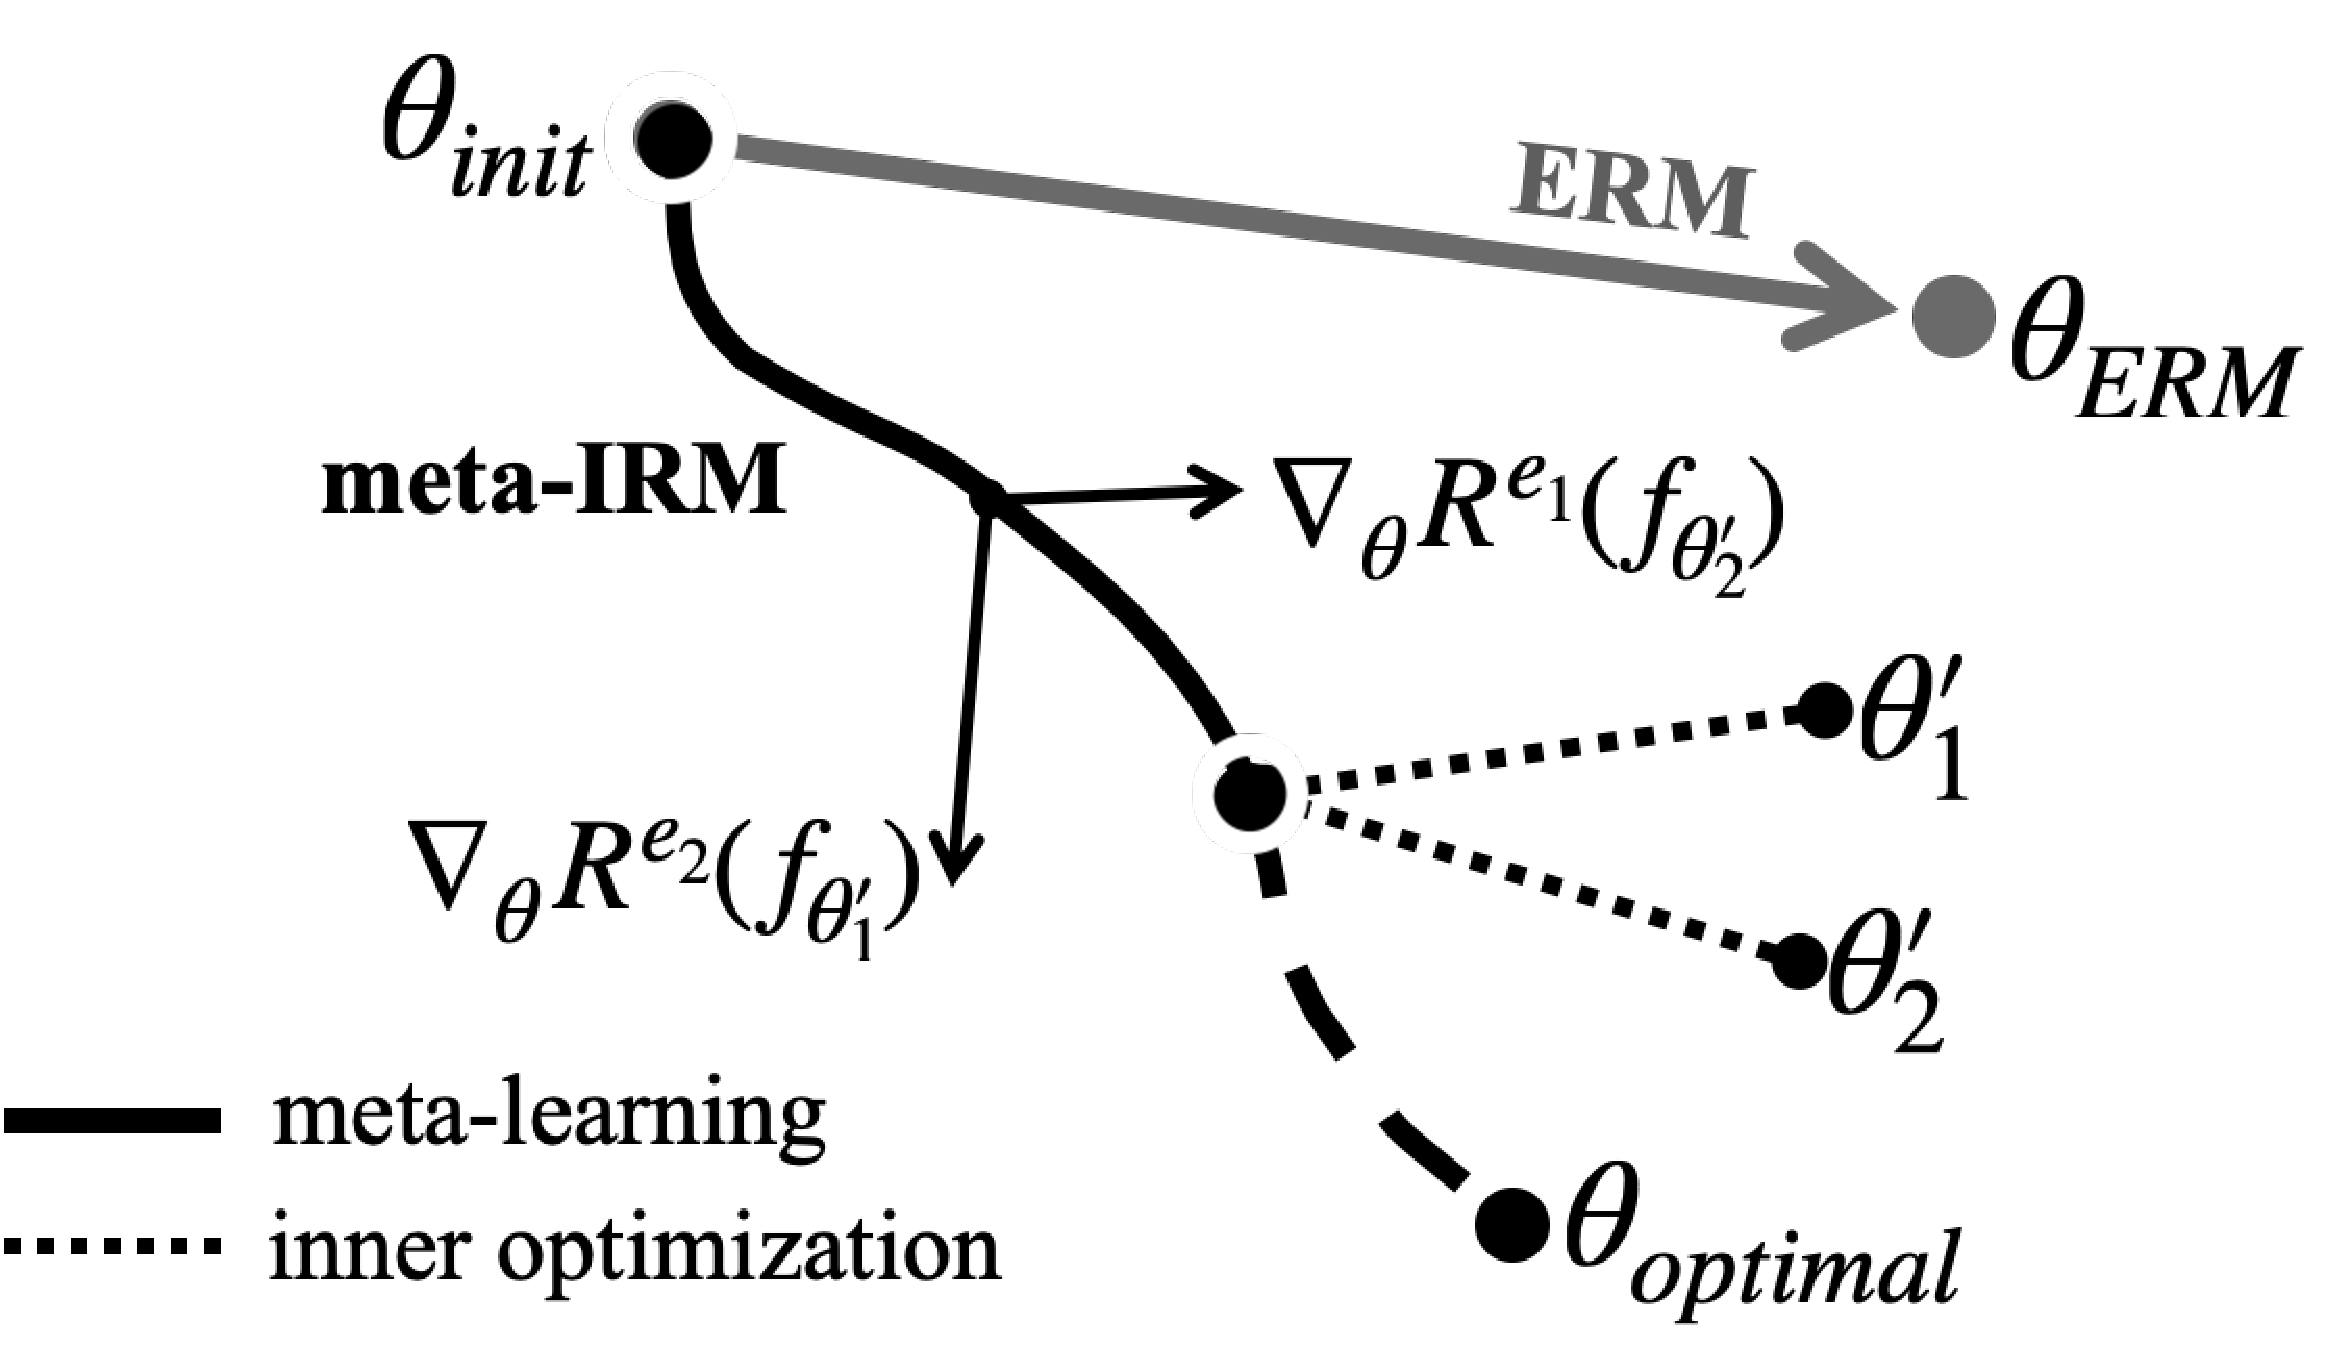
Diagram of meta-IRM. Gradients from environment-adapted parameters are combined to converge toward the invariant feature direction ($\theta_{optimal}$).
Method
IRM aims to find an invariant predictor across multiple training environments. Meta-IRM approaches this using the MAML framework, with a key insight: assigning different training environments to the inner loop and outer loop. Since spurious correlations vary across environments, combining gradients from different environments drives convergence toward invariant features.
Meta-Learning Framework
The inner/outer structure of MAML maps onto the IRM objective. The inner loop adapts to one environment, while the outer loop (meta-loss) evaluates on a different environment.
Inner optimization: Adapt model parameters to each training environment \(e_i\) :
\[\theta_i' = \theta - \alpha \nabla_\theta R^{e_i}(f_\theta)\]Meta-optimization: Update \(\theta\) using meta-losses computed from different environments \(e_j\) with adapted parameters \(\theta_i'\) :
\[\theta \leftarrow \theta - \beta \nabla_\theta \left\{ \sum_i \sum_j R^{e_j}(f_{\theta_i'}) + \lambda \sigma \right\}, \quad e_j \sim \mathcal{E}_{tr} \setminus e_i\]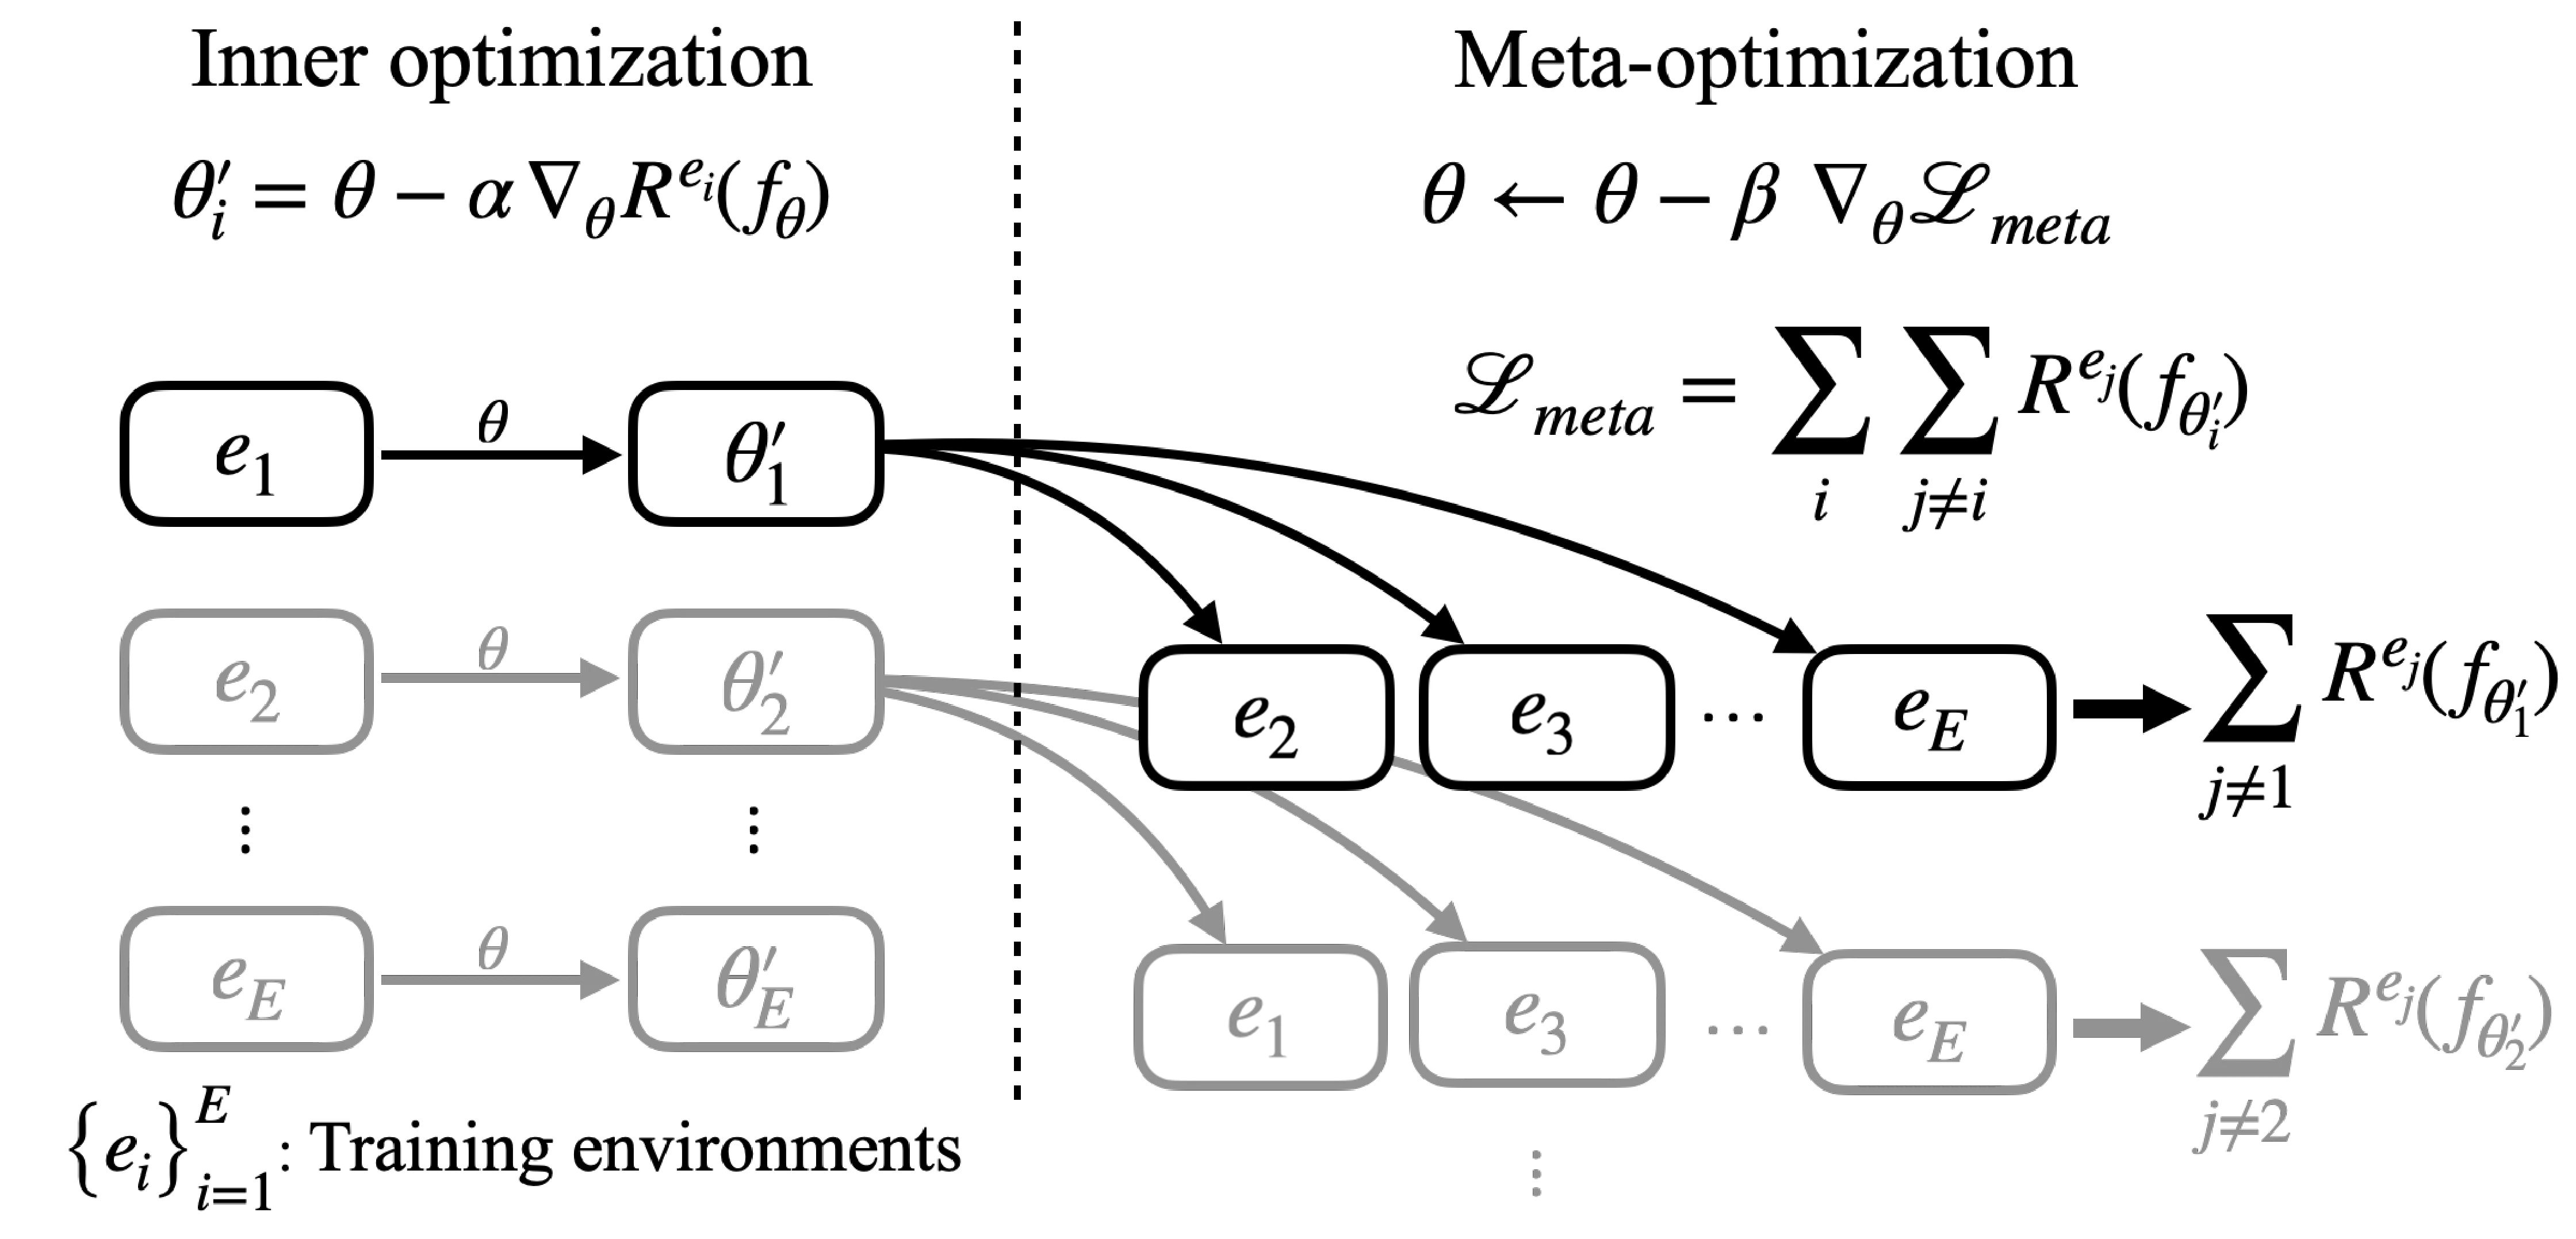
Schematic of meta-IRM learning process. Model parameters $\theta$ are adapted to training environments in the inner optimization; each adapted parameter computes meta-loss from different environments.
Auxiliary Standard Deviation Loss
An auxiliary loss based on the standard deviation \(\sigma\) of meta-losses encourages uniform performance across all environments. This regularization improves training stability and convergence speed.
Results
Colored MNIST
Test accuracy (%) on Colored MNIST. $p_e=0.9$ is the OOD environment (reversed color-label correlation).
| Algorithm | \(p_e=0.1\) | \(p_e=0.2\) | \(p_e=0.9\) (OOD) |
|---|---|---|---|
| ERM | 88.6 ± 0.3 | 79.7 ± 0.6 | 16.4 ± 0.8 |
| IRMv1 | 71.4 ± 0.9 | 70.8 ± 1.0 | 66.9 ± 2.5 |
| MM-REx | 70.8 ± 1.5 | 70.4 ± 2.0 | 66.1 ± 4.9 |
| V-REx | 71.5 ± 0.8 | 71.1 ± 0.9 | 68.6 ± 1.2 |
| meta-IRM (Ours) | 70.9 ± 0.9 | 70.8 ± 1.0 | 70.4 ± 0.9 |
| Random | 50 | 50 | 50 |
| ERM (grayscale) | 72.6 ± 0.3 | 72.7 ± 0.3 | 73.0 ± 0.5 |
| Optimal | 75 | 75 | 75 |
meta-IRM (70.4%) surpasses V-REx (68.6%), IRMv1 (66.9%), and MM-REx (66.1%), approaching the theoretical optimum (75%) most closely. Notably, the OoD standard deviation of 0.9 is substantially lower than other methods (IRMv1 2.5, MM-REx 4.9), demonstrating stable invariant feature learning. ERM (grayscale), trained on images without the spurious color feature, serves as a reference point (73.0%); meta-IRM’s proximity to it indicates that color spurious correlations are almost fully excluded.
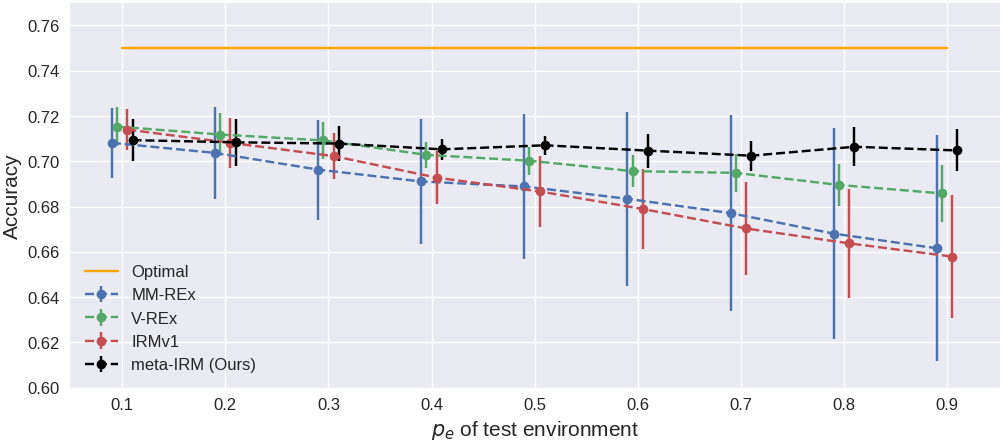
Accuracy across test environments ($p_e$ from 0.1 to 0.9).
Multi-Class Problem
As the number of classes increases, the structure of spurious correlations becomes more complex, and meta-IRM’s advantage becomes more pronounced.
Multi-class Colored MNIST ($k$=5, 10) test accuracy (%).
| Algorithm | # Classes | Train | Test (OOD) |
|---|---|---|---|
| ERM | 5 | 95.2 ± 0.2 | 41.0 ± 0.6 |
| IRMv1 | 5 | 82.2 ± 0.4 | 62.0 ± 2.4 |
| meta-IRM (Ours) | 5 | 76.4 ± 1.4 | 74.0 ± 3.6 |
| Random | 5 | 20 | 20 |
| ERM (grayscale) | 5 | 73.2 ± 0.2 | 71.7 ± 0.4 |
| ERM | 10 | 92.6 ± 0.2 | 39.2 ± 0.9 |
| IRMv1 | 10 | 83.4 ± 0.5 | 58.6 ± 2.5 |
| meta-IRM (Ours) | 10 | 79.5 ± 0.6 | 73.4 ± 3.2 |
| Random | 10 | 10 | 10 |
| ERM (grayscale) | 10 | 73.2 ± 0.1 | 71.9 ± 0.5 |
| Optimal | — | 75 | 75 |
In the 10-class setting, meta-IRM (73.4%) surpasses IRMv1 (58.6%) by 14.8pp and exceeds the ERM (grayscale) reference (71.9%). This indicates that as the number of classes grows, IRMv1’s penalty term becomes insufficient, while meta-IRM’s cross-environment evaluation drives convergence toward invariant features regardless of problem complexity.
Insufficient Data
We evaluate how well IRM-family methods maintain performance when training data is halved (25,000 to 12,500 per environment).
Test accuracy (%) with reduced training data (12,500 per environment).
| Algorithm | \(p_e=0.1\) | \(p_e=0.2\) | \(p_e=0.9\) (OOD) |
|---|---|---|---|
| IRMv1 | 73.2 ± 1.6 | 71.7 ± 1.3 | 58.5 ± 2.5 |
| V-REx | 75.0 ± 0.8 | 73.4 ± 0.6 | 61.3 ± 1.4 |
| meta-IRM (Ours) | 70.6 ± 1.5 | 70.5 ± 1.6 | 68.3 ± 2.3 |
| Optimal | 75 | 75 | 75 |
When data is halved, IRMv1 drops from 66.9% to 58.5% (an 8.4pp decline), while meta-IRM drops only from 70.4% to 68.3% (2.1pp). This demonstrates that the meta-learning-based optimization efficiently extracts invariant features even under data-scarce conditions.
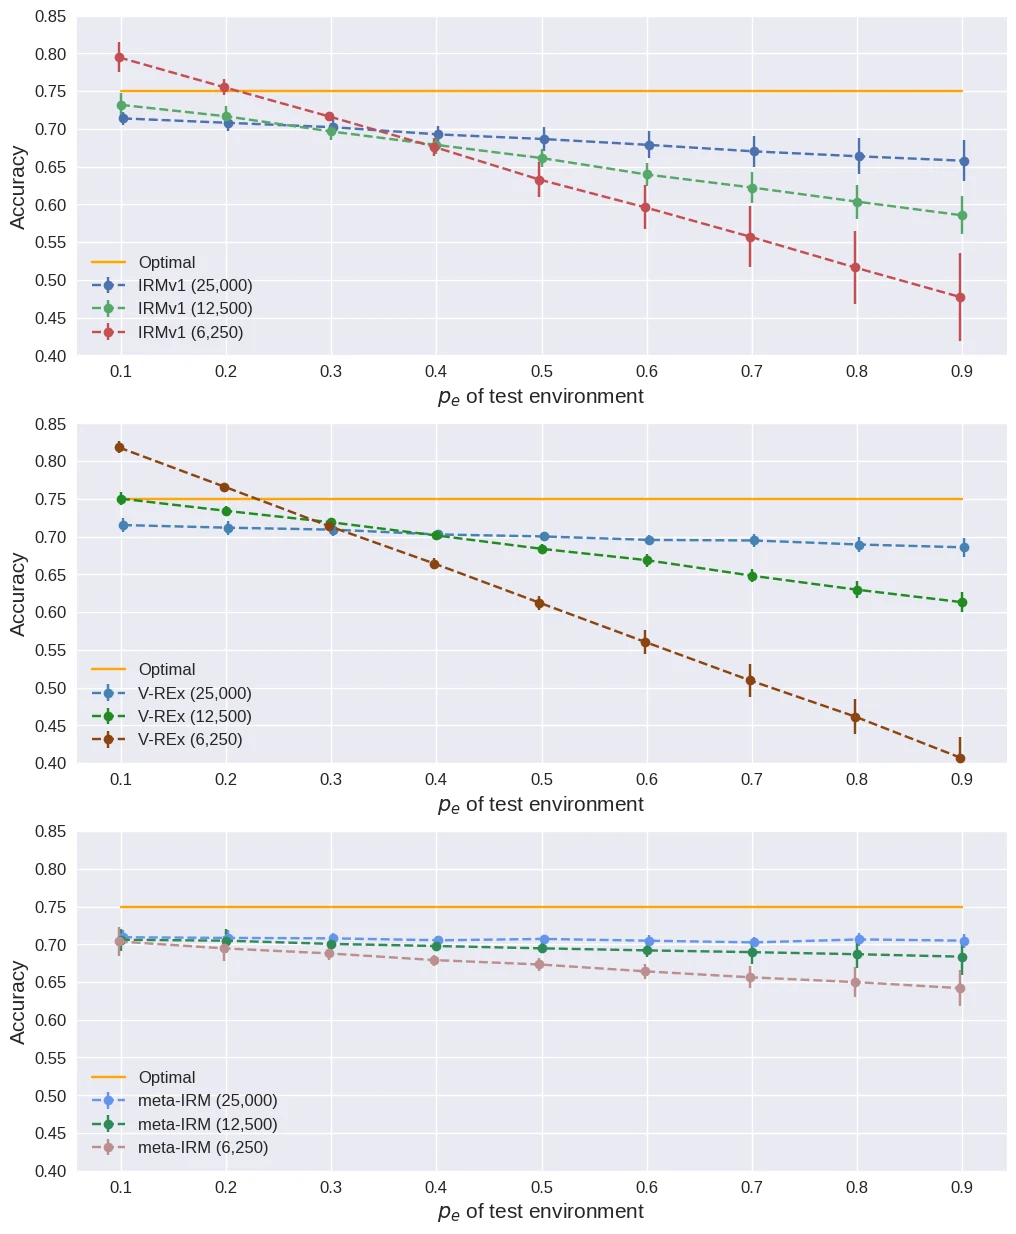
Effect of decreasing training data (25,000 → 12,500 → 6,250).
Two Spurious Features
This setting introduces 2 spurious correlations (color + patch) with only 2 training environments. Under these conditions, the theoretical guarantees of IRMv1 do not hold (number of spurious features > number of environments).
| Algorithm | \(p_e=0.1\) | \(p_e=0.2\) | \(p_e=0.9\) (OOD) |
|---|---|---|---|
| IRMv1 | 93.5 ± 0.2 | 86.4 ± 0.3 | 13.4 ± 0.3 |
| V-REx | 93.6 ± 0.4 | 86.3 ± 0.3 | 13.5 ± 0.3 |
| meta-IRM (Ours) | 58.1 ± 3.1 | 56.8 ± 2.9 | 54.5 ± 4.0 |
| Optimal | 75 | 75 | 75 |
IRMv1 and V-REx drop to 13.4–13.5%, falling below random chance (50%). Both methods exploit both spurious features to achieve high in-distribution accuracy, but when both correlations reverse simultaneously in the OoD setting, performance collapses. meta-IRM achieves 54.5% — suboptimal but above random — indicating that invariant feature learning is at least partially maintained.
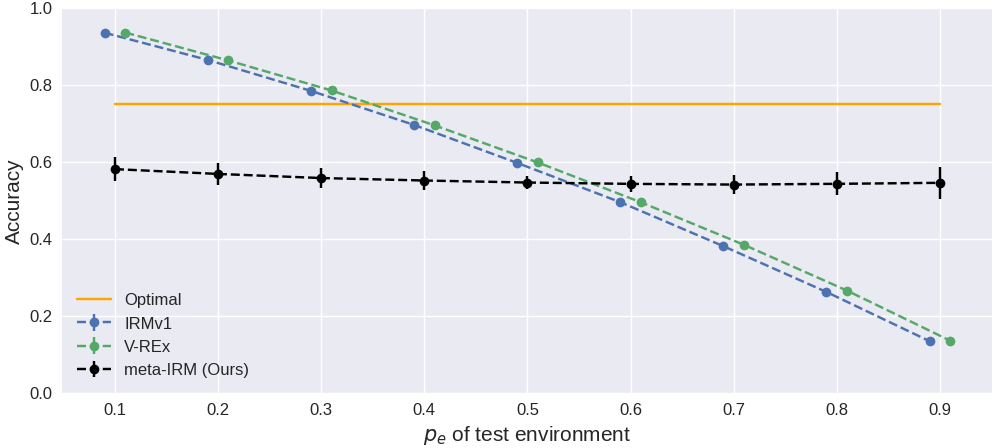
Test accuracy with two spurious features (color + patch) across environments.
PunctuatedSST-2 (NLP)
We verify whether the principles from Colored MNIST transfer to NLP using PunctuatedSST-2, a sentiment analysis task where punctuation marks ("!" vs “.”) serve as spurious features.
PunctuatedSST-2 test accuracy (%). $\eta_e$ is the label noise rate.
| Algorithm | \(\eta_e\) | Test (OOD) |
|---|---|---|
| ERM | 0.25 | 30.7 ± 1.5 |
| IRMv1 | 0.25 | 62.0 ± 1.9 |
| meta-IRM (Ours) | 0.25 | 62.2 ± 1.8 |
| ERM (vanilla) | 0.25 | 62.3 ± 0.5 |
| Optimal | 0.25 | 75 |
| ERM | 0 | 56.2 ± 2.9 |
| IRMv1 | 0 | 67.4 ± 1.4 |
| meta-IRM (Ours) | 0 | 73.0 ± 0.7 |
| ERM (vanilla) | 0 | 76.7 ± 2.7 |
| Optimal | 0 | 100 |
Without label noise (\(\eta_e=0\) ), meta-IRM (73.0%) surpasses IRMv1 (67.4%) by 5.6pp and approaches the ERM (vanilla) reference (76.7%), trained on SST-2 without the punctuation spurious feature. With label noise (\(\eta_e=0.25\) ), meta-IRM (62.2%) is effectively tied with ERM (vanilla, 62.3%) and nearly matches IRMv1 — label noise caps the information content of the invariant feature itself, so the gap between methods vanishes and all of them effectively reach the ceiling attainable once the punctuation correlation is removed.
Ablation Study
| Variant | \(p_e=0.1\) | \(p_e=0.9\) (OOD) |
|---|---|---|
| w/o std. loss | 73.0 ± 0.8 | 64.2 ± 3.2 |
| First-order approx. | 62.6 ± 5.5 | 59.1 ± 6.3 |
| Same env. (inner = meta) | 89.3 ± 1.6 | 13.6 ± 6.6 |
| meta-IRM (Full) | 70.9 ± 0.9 | 70.4 ± 0.9 |
| Optimal | 75 | 75 |
The same environment (inner = meta) variant collapses to 13.6%, exhibiting an ERM-level failure. This is the definitive result confirming that assigning different environments to the inner and outer loops is the core mechanism of meta-IRM. First-order approximation degrades both performance and stability due to loss of second-order gradient information (59.1% ± 6.3). Removing the standard deviation loss reduces OoD performance by 6.2pp and increases the run-to-run standard deviation (3.2 vs 0.9).